by
by Hello guys! When we are investigating errors or resolving a bug in our app, we all know the struggle of finding and fixing it. In this post, we will talk about how to find bugs, more specifically, which debugging tools and commands we can use to help us with nice logs in our browser’s console.
We will be talking about JavaScript debugging and in each section, sharing some code samples that you can run, and prints and GIFs to help you to understand each command.
Let’s start it!
debugger
You can use debugger statement as a breakpoint that will stop your code on it. Then, you can check your variables’ values, update them and run any JS code you wish.
Sample code:
const main = (params = {}) => {
  let variable1 = params.foo
  const variable2 = variable1 || 'default'
  const variable3 = () => {
    return ${variable1}!!!
  }
  debugger
  const variable4 = 123
  const variable5 = params.bar ?? 'bar'
  debugger
}

main({ bar: 'test' })

As you can see in the GIF, it will pause the execution of the application whenever it finds a debugger statement, and then you can check the current state of your code, interact with it or debug step by step.
The same behavior can be achieved when adding a breakpoint through your browser Sources (or Debugger, in Firefox) tab, simply by clicking on a line number.

All breakpoints are visible under the breakpoints section, in developer tools.

Step by step debug
On top of the breakpoints list, you have access to the debug commands that are used for step by step debugging, which can also be accessed by the keyboard shortcuts. The commands are:
- Pause/Continue (
F8)Pause script execution or continue until the next breakpoint or the end of the script.
Step Over (
F10)Jump to the next line or statement, executing the code on the current line.
Step Into (
F11)Jump into a function and start debugging its body.
Step Out (
Shift + F11)Jump out of a function and execute the remaining lines of its body.
console.log
The console.log(...args) will output in your browser’s console whatever you pass to it, and it accepts multiple arguments.
Sample code:
console.log(123, 456, 789)
console.log('foo', 'bar')
console.log(true)
console.log({ id: 1, name: 'John' })
console.log([1, 2, true, false, { age: 18 }, ['foo', 'bar']])

Logging multiple variables
When you need to log multiple variables, it’s common to see multiple console.log‘s with a string with your variable name and the variable itself.
Sample code:
const name = 'Julia'
const skills = ['JavasScript', 'TypeScript']

console.log('name: ', name)
console.log('skills: ', skills)

In this situation, I like to create an object with the variables so, you don’t need to declare multiple console.log‘s.
Sample code:
const name = 'Julia'
const skills = ['JavasScript', 'TypeScript']

console.log({ name, skills })

Logging a object formatted as JSON
If you have an object, and you want to see it formatted in your console instead of an interactive object, where you need to click on each property to see what is on it. You can use JSON.stringify(object, null, 2) to log your object as a string.
const myObject = {
  name: 'John',
  age: 30,
  address: { street: '123 Main St', city: 'New York', state: 'NY' },
  hobbies: [{ name: 'Sports', type: 'outdoor' }, { name: 'Cooking', type: 'indoor' }],
}

console.log(JSON.stringify(myObject, null, 2))

console.error
The console.error(...args) will log an error in the console in red and will add the stack trace of it.
It’s ideal to use in any catch or error handling to know more about your error.
const functionA = () => {
  functionB()
}

const functionB = () => {
  functionC()
}

const functionC = () => {
  try {
    throw new Error('unexpected error')
  } catch (error) {
    console.error(error)
  }
}

const main = () => {
  functionA()
}

main()

console.warn
The console.warn(message) will log a warning message in your console.
const double = (number) => {
  console.warn('The function "double" is deprecated. Please use "calcDouble" instead.')
  return number + number
}

const calcDouble = (number) => number * 2

double(2)

console.clear
The console.clear() will clear everything that was logged or written in your console.
console.log('Hello World')

const double = (number) => number * 2

console.group('Running the function')
console.log(double(2))
console.groupEnd()

console.clear()

console.trace
The console.trace(message) will log the stack trace from where it’s called.
const functionA = () => {
  functionB()
}

const functionB = () => {
  functionC()
}

const functionC = () => {
  console.trace('I am inside functionC')
}

const main = () => {
  functionA()
}

main()

console.dir
The console.dir(object) is more focused to log objects. It will show an interactive list of each property of the object, so you can navigate.
I’m not gonna lie, it’s very similar to console.log when you pass an object, but there is one difference: it will always log like an object.
The best way to explain that is through the code:
const myObject = { id: 123, person: { name: 'Amélia', skills: ['JavaScript', 'Ruby on Rails'] }, foo: 'bar' }

console.log(myObject)
console.dir(myObject)

For pure JS objects, console.dir you won’t see much difference in the output, but when handling other kinds of object like DOM Elements, it will show the element properties instead of the element itself.
Sample code:
console.log(document.body)
console.dir(document.body)

console.table
The console.table(array) will create a beautiful table in your console from the parameter you passed in, which can be either an array or object. You can also sort each column and display a subset of columns by adding a second argument to it.
This log is most useful when you are handling with an Array object.
const myArray = [
  { id: 1, name: 'Marcelo', age: 24 },
  { id: 2, name: 'Lucia', age: 18 },
  { id: 3, name: 'Klaus', age: 40 },
  { id: 4, name: 'Agnes', age: 51 },
]

console.table(myArray)

console.count and console.countReset
The console.count(name?) will show how many times the logger was called according to the name passed.
Let’s start with a simple example:
console.count('my counter')
console.count('my counter')
console.count('my second counter')
console.count('my second counter')
console.count('my counter')

This can be very useful if you are using React and want to know how many time a component has been rendered:
const MyComponent = () => {
    console.count('MyComponent')
    ...
}
Another example is with the recursive fibonacci function. If you want to know how many times it was called, you can add a console.count('fibonacci') in the beginning.
If you want to reset the counter, you can run console.count('fibonacci').
const fibonacci = (number) => {
  console.count('fibonacci')
  if (number < 2) return number

  return fibonacci(number - 1) + fibonacci(number - 2)
}

fibonacci(4)
fibonacci(4)

console.countReset('fibonacci')

fibonacci(4)
In this way, we check how many times fibonacci was called.

console.group and console.groupCollapsed
The console.group(name?) will log and create a group where the next logs will be indented until close the group by running console.groupEnd(name?).
It’s a good utility when you have a bunch of logs from different functions.
Sample code:
const functionA = () => {
  console.group('[functionA]')
  console.log('Executing...')
  functionB()
  console.log('Finished!')
  console.groupEnd()
}

const functionB = () => {
  console.group('[functionB]')
  console.log('Executing...')
  console.log('Finished!')
  console.groupEnd()
}

const main = () => {
  console.group('[main]')
  console.log('Logging in "main" function')
  functionA()
  console.groupEnd()
}

As I mentioned, It will indent the logs, and you can open or close then.
By default, all groups will be opened and if you want them to be closed, you just need to replace console.group(name?) by console.groupCollapsed(name?).
const functionA = () => {
  console.groupCollapsed('[functionA]')
  console.log('Executing...')
  functionB()
  console.log('Finished!')
  console.groupEnd()
}

const functionB = () => {
  console.groupCollapsed('[functionB]')
  console.log('Executing...')
  console.log('Finished!')
  console.groupEnd()
}

const main = () => {
  console.groupCollapsed('[main]')
  console.log('Logging in "main" function')
  functionA()
  console.groupEnd()
}

console.time
The console.time(name?) method can be handy to measure performance in your code. By calling console.time(name?) before you execute your expensive code and console.timeEnd(name?) after it will output how many milliseconds it took.
Sample code:
const fastMethod = () => {
  for (let i = 0; i < 100; i++) {}
}

const slowMethod = () => {
  for (let i = 0; i < 100000000; i++) {}
}

const main = () => {
  console.time('[fastMethod]')
  fastMethod()
  console.timeEnd('[fastMethod]')

  console.time('[slowMethod]')
  slowMethod()
  console.timeEnd('[slowMethod]')
}

main()

console.assert
The console.assert(assertion, ...args) works like a unit test framework. It will log an error message with ...args if the assertion is not satisfied, otherwise, it will show nothing.
Example code:
const isNumber = (value) => typeof value === 'number'

const values = [1, '2', true, false, {}, []]

values.forEach((value) => {
  console.assert(isNumber(value), "${value}" is not a number, { value })
})
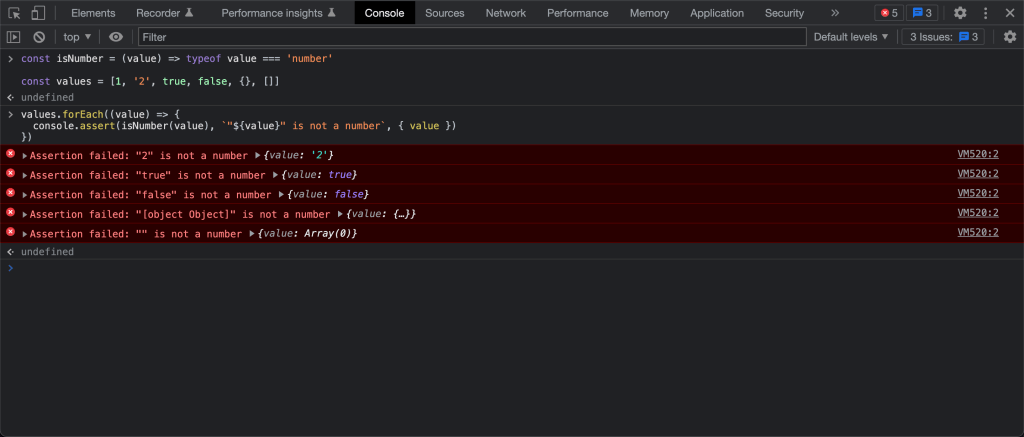
In this example, when the value is 1 the console.assert will not log but in the other cases it will log because isNumber(value) will return false.
Conclusion
It’s very good and important to know all tools and commands we can use to help us to debug our apps. Especially nowadays that we have applications with such complex structures.
So, keep in mind you have a ton of possibities to try over a simple console.log that will help to get most out of your bug hunt.
Also, try to run all samples available in this post to make sure you understand each command as it may help you to glue these commands in your mind more rapidly.
And don’t forget to leave your thoughts in the comments section. Thanks for reading ❤️
We want to work with you. Check out our Services page!