Mapbox, the “Google” for working with map applications
A simple introduction and practice to learn how to use mapbox lib for web appsHello boys and girls!!! In this article I’ll be discussing the Mapbox, an American provider (APIs and SDKs) for custom online maps for web and mobile apps. We’ll be talking about some of the main tools that it provides and how to use them on a web application context.
First of all, let’s take a look on what are the services supplied by this amazing provider:
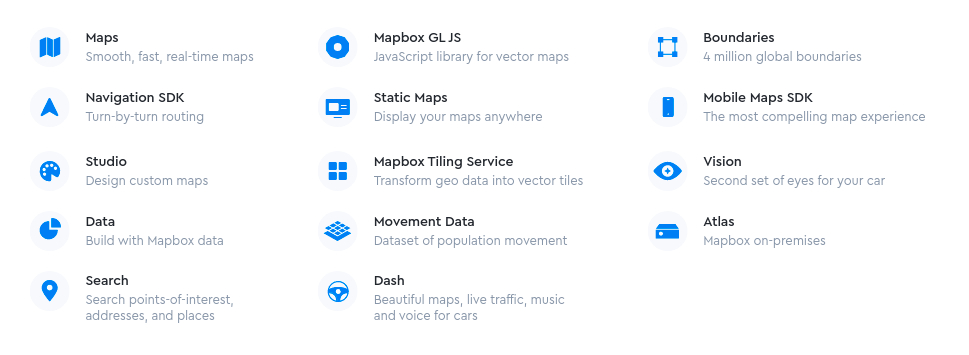
The Mapbox provides a lot of tools to work with standard maps, routes, population movement, search locations, maps for mobile and much more…
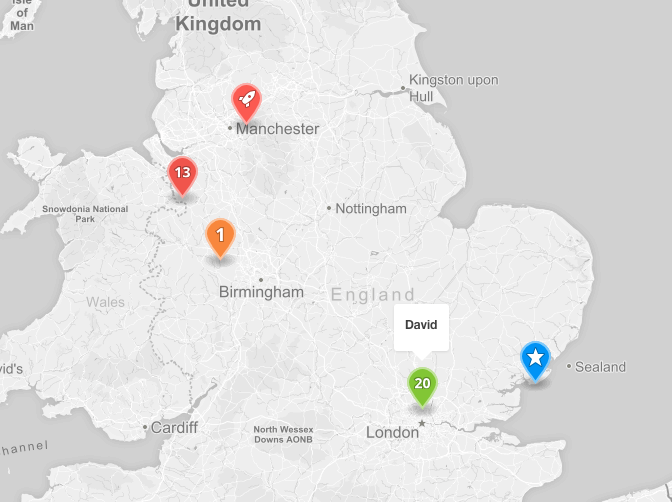
So, in this article I will focus in showing you some practical examples on building a simple web app that uses markers and geojson data. Markers are points placed on the map to indicate a location (using latitude and longitude), as you can see in the picture bellow:
Geojson is a JSON format specification that works with geometry types (Points, LineString, Polygons and others), this format is very popular within the comunity due to it being easy to manipulate and understand. The JSON bellow is an Geojson data example of a polygon.
{
    "type": "Feature",
    "geometry": {
        "type": "Polygon",
        "coordinates": [
            [
                [-53.94518852233887,-18.88931481299371],
                [-53.94540309906005,-18.889883270416817],
                [-53.94454479217529,-18.89004568646896],
                [-53.94518852233887,-18.88931481299371]
            ]
        ]
    }
}
If you copy & paste this JSON in the Geojson playground: geojson.io, you can see the exact drawing bellow:

Now, let’s practice guys!!! We’ll develop together a simple Next.js app with a map to show you how to setup your Mapbox GL JS. In this app we’ll use markers, geojson data and draw ours own polygons! Cool?
First, let’s setup a Next.js app with Typescript using Yarn:
yarn create next-app --typescript
After creating your base app, let’s install the Mapbox’s dependencies, the core and the component to draw polygons:
yarn add mapbox-gl
yarn add @mapbox/mapbox-gl-draw
But, first let’s create our own API, /api/markers, to consume our markers data using the API Routes feature from Next.js
import type { NextApiRequest, NextApiResponse } from "next";
import { Marker } from "../../src/shared/types";
import markers from "./__mocks__/markers.json";

export default function handler(req: NextApiRequest, res: NextApiResponse<Marker[]>) {
    res.status(200).json(markers);
}
This API service is responsible for returning to the application a collection of markers in a JSON. The response should follow the structure below:
[
    {
        "description": "Brazilian Serie A",
        "imageUrl": "https://upload.wikimedia.org/wikipedia/en/4/42/Campeonato_Brasileiro_S%C3%A9rie_A_logo.png",
        "coordinates": [-15.419902, -50.815938]
    },
    {
        "description": "Bundesliga",
        "imageUrl": "https://futhead.cursecdn.com/static/img/17/leagues/19.png",
        "coordinates": [50.827005, 10.253952]
    },
    {
        "description": "Premier League",
        "imageUrl": "https://2.bp.blogspot.com/-AsCk3Cgq1qA/WlRt-vX7LxI/AAAAAAAAHwk/Y1j8gkH0Xywp66dz5i35ueIIlwDLj078wCLcBGAs/s1600/0001%2B-%2BING%2B1.png",
        "coordinates": [53.100855, -1.633254]
    },
    {
        "description": "Ligue 1 Uber Eats",
        "imageUrl": "https://lh3.googleusercontent.com/proxy/NqeifZEQVB9xdm6nefMugUgMIzPWnXIlb5BSagYOYbJv9Y8pN1vLSWu0R2PhTYzzk9dhZA8e24RlllhzFaZrT3KYcoUDsW8XJPU",
        "coordinates": [48.763688, 2.179001]
    },
    {
        "description": "La Liga",
        "imageUrl": "https://apprecs.org/ios/images/app-icons/256/af/545609647.jpg",
        "coordinates": [39.791954, -3.072463]
    },
    {
        "description": "Serie A TIM",
        "imageUrl": "https://www.pesmaster.com/pes-2020/graphics/leaguelogos/emb_0010.png",
        "coordinates": [42.771383, 12.530614]
    }
]
Now we create our MapView component:
As a side note, you need to create your account on the Mapbox platform to get the access token that allows you to use it.
Returning to component creation, we need to use two ref objects using useRef hook, one to refer the HTML tag (mapContainer) that the map view will be injected into and another one for the Map component instance (map).
  const mapContainer = useRef<any>(null);
  const map = useRef<any>(null);
Our JSX can be defined like this:
return <div ref={mapContainer} className={styles["map-container"]} />;So, to instance the Map component, we just need set a few things in our main useEffect
useEffect(() => {
    if (map.current) return; // initialize map only once

    map.current = new mapboxgl.Map({
        container: mapContainer.current,
        style: "mapbox://styles/mapbox/streets-v11",
        center: [0, 0],
        zoom: 2,
    });
});
This useEffect is responsible for instantiating the Map component. We just need to define some props at the mapboxgl.Map constructor: container that receives the mapContainer ref object; style, responsible for loading the Map image tiles. For this app I choose the streets-v11, but you can use other styles: check this link.
Now, let’s load the markers to be placed at the Map component. For this, we need to create a simple custom hook to request data from our API:
import { useEffect, useState } from "react";
import { Marker } from "../shared/types";

export const useChampionshipMarkers = (): Marker[] => {
    const [markers, setMarkers] = useState<Marker[]>([]);

    useEffect(() => {
        fetch("/api/markers")
            .then((response) => response.json())
            .then((response) => setMarkers(response))
            .catch(() => setMarkers([]));
    }, []);

    return markers;
};
In our pages/index.jsx Home component we call that custom hook and pass the value we retrieved as a prop to our MapView component:
import type { NextPage } from "next";
import MapView from "../src/components/MapView";
import Footer from "../src/components/shared/Footer";
import AppHeader from "../src/components/shared/Header";
import { useChampionshipMarkers } from "../src/hooks/useChampionshipMarkers";
import styles from "../styles/Home.module.css";

const Home: NextPage = () => {
    const markers = useChampionshipMarkers();

    return (
        <div className={styles.container}>
            <AppHeader />
            <main className={styles.main}>
                <MapView markers={markers} />
            </main>
            <Footer />
        </div>
    );
};

export default Home;
So, in MapView, for plotting the marker on the map we need to use the useEffect hook to watch for the markers props for proper rendering on the specific coordinate.
useEffect(() => {
    if (!map.current) return;

    markers.forEach((marker) => {
        addMakerPopup(marker, map.current);
    });
}, [markers]);
The addMakerPopup function is responsible for plotting each marker on the Map, the code is simple:
const addMakerPopup = (marker: Marker, map: any) => {
    const [lat, lon] = marker.coordinates;
    const popup = new mapboxgl.Popup({ offset: 25 }).setText(marker.description);

    const el = document.createElement("div");
    el.className = styles.marker;
    el.style.backgroundImage = url('${marker.imageUrl}');

    new mapboxgl.Marker(el).setLngLat([lon, lat]).setPopup(popup).addTo(map);
};
The fist step it is to instanciate a Popup to show some more info for when a marker is clicked, in this case, a description. The second is to create a div that will contain an image to represent the marker. And then, finally insert the marker in a specific longitude & latitude on the map. Here’s the final result:

We’re almost there! Let’s see how to load Geojson data. Remember that first useEffect we talked about? We need to use a ‘load’ event listener that allows us to do run some logic for when the Map component is fully rendered, in our case, we’re loading the Geojson data.
useEffect(() => {
    // ....
    map.current.on("load", () => {
        loadGeojson(map.current);
    });
});
The loadGeojson function is simple to understand, here’s an example:
const loadGeojson = (map: any) => {
    // This part is responsible for fetching the Geojson data from the given url (this url brings all the brazilian cities) and stores the data as a source
    map.addSource("brazil", {
        type: "geojson",
        data: "https://raw.githubusercontent.com/tbrugz/geodata-br/master/geojson/geojs-100-mun.json",
    });

    // This part is responsible for adding a map layer on the source stored above with a fill color.
    map.addLayer({
        id: "brazil",
        type: "fill",
        source: "brazil",
        layout: {},
        paint: {
            "fill-color": "#1ebd68",
            "fill-opacity": 0.5,
        },
    });

    // This part is responsible for adding an outline for each layer added on the map.
    map.addLayer({
        id: "outline",
        type: "line",
        source: "brazil",
        layout: {},
        paint: {
            "line-color": "#105c33",
            "line-width": 1,
        },
    });

    // This part takes care of adding a click event for when the user clicks on a layer and shows a popup with the description.
    map.on("click", "brazil", (e: any) => {
        const description = e.features[0].properties.description;

        new mapboxgl.Popup({ offset: 25 })
            .setLngLat(e.lngLat)
            .setHTML(description)
            .addTo(map);
    });

    // Finally these event listeners are responsible for changing the mouse cursor style on hover.
    map.on("mouseenter", "brazil", () => {
        map.getCanvas().style.cursor = "pointer";
    });

    map.on("mouseleave", "brazil", () => {
        map.getCanvas().style.cursor = "";
    });
};
Here’s the final result:

If you came all this way, you’re a champion! This is the last step! It’s about drawing your own polygon. First, we need to import the component MapboxDraw and create a function that instanciates this component:
import MapboxDraw from "@mapbox/mapbox-gl-draw";

const getDrawControls = () => {
    const draw = new MapboxDraw({
        displayControlsDefault: false,
        controls: {
            polygon: true,
            trash: true,
        },
    });

    return draw;
};
Now, we call this getDrawControls function on the first useEffect of our MapView component:
useEffect(() => {
    // ....
    const drawControls = getDrawControls();
    map.current.addControl(drawControls);
});
And we use the addControl method from the Map component and add the drawControls instance. Here’s the result again:

And finally, put everything together:
mapboxgl.accessToken = MAPBOX_TOKEN;

interface IMapView {
    markers: Marker[];
}

const MapView = ({ markers }: IMapView) => {
    const mapContainer = useRef<any>(null);
    const map = useRef<any>(null);

    useEffect(() => {
        if (map.current) return; // initialize the map only once

        map.current = new mapboxgl.Map({
            container: mapContainer.current,
            style: "mapbox://styles/mapbox/streets-v11",
            center: [0, 0],
            zoom: 2,
        });

        const drawControls = getDrawControls();

        map.current.addControl(drawControls);
        map.current.on("load", () => {
            loadGeojson(map.current);
        });
    });

    useEffect(() => {
        if (!map.current) return;

        markers.forEach((marker) => {
            addMakerPopup(marker, map.current);
        });
    }, [markers]);

    return <div ref={mapContainer} className={styles["map-container"]} />;
};

export default MapView;
If you want more details or have any doubts follow me on Github, access the repo below 🙂
We want to work with you. Check out our Services page!
 Gabriel Quaresma